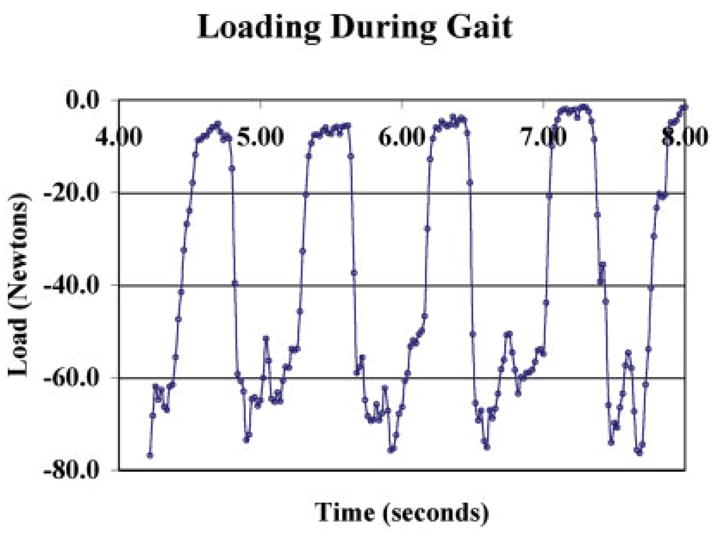
Figure 7.

Representative graph of load measurements during gait from the stifle joint of dog. Repeated collection of these loads over several weeks produced the same patterns and the same peak loads within each dog. [Color figure can be viewed in the online issue, which is available at www.interscience.wiley.com.].
