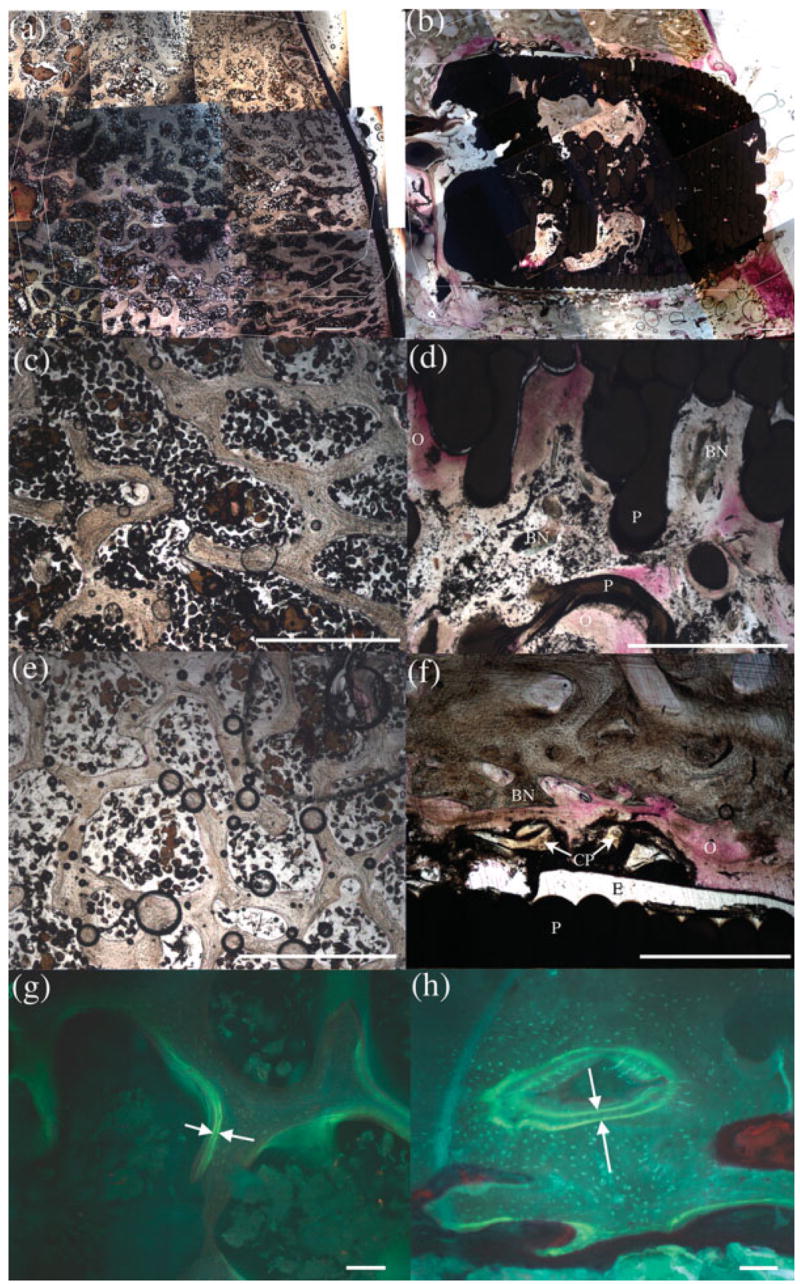
Figure 9.

(a) and (b) are representative images portraying overall layout and composition of both control and experimental slides, respectively, at 6 months post-op. Magnified images of the experimental scaffold region revealed less bone volume (d) than the control (c). The experimental periscaffold region (f) presented significantly more bone volume and a wider double label distance (h) than the control (e and g). Within each image, (BN) indicates bone; (CP) represents CPC particles; (E) marks epoxy; (O) denotes osteoid; and (P) signifies the PBT scaffold. Scale bar is 1mm in (a) through (f) and 100 μm in (g) and (h). [Color figure can be viewed in the online issue, which is available at www.interscience.wiley.com.].
