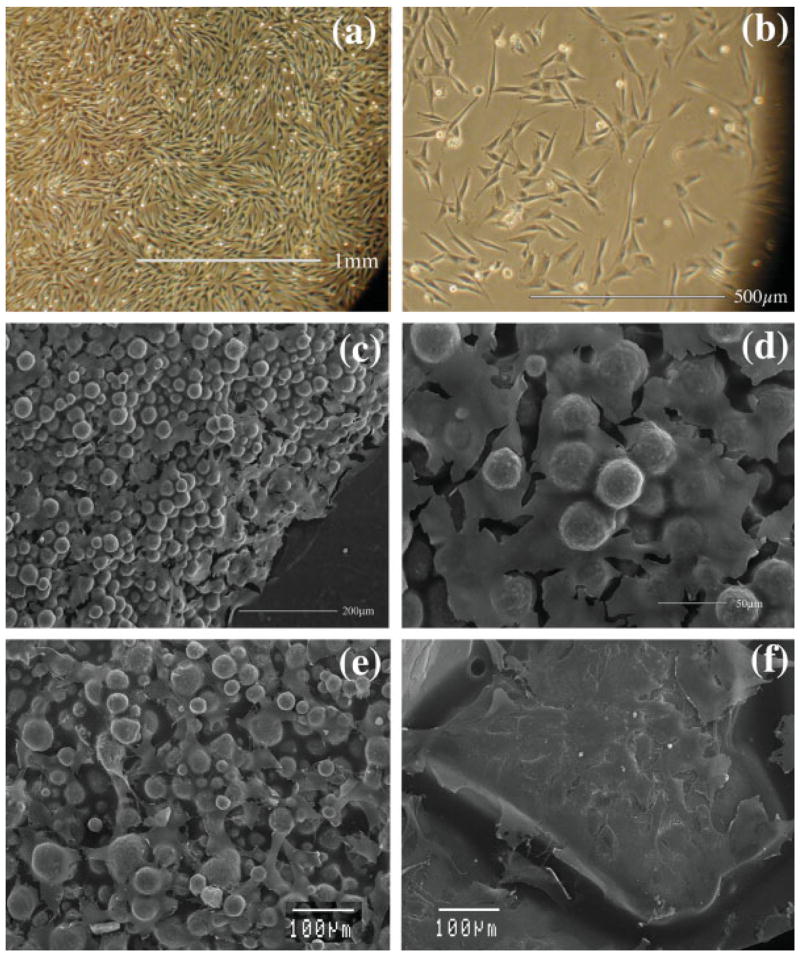
Figure 2.

This collage of pictures shows (a) pictures taken with an inverted microscope showing MVECs in culture dishes at 100×. (b) Picture taken with an inverted microscope showing MVECs in culture dishes at 200×. (c) A scanning electron micrograph taken at 150× magnification shows a continuous layer of BDCs on a CPC surface. (d) A scanning electron micrograph taken at 450× magnification shows a higher magnification view of the continuous layer of BDCs on a CPC surface. (e) A scanning electron micrograph taken at 300× shows CDCs on the small particle sized CPC 2. (f) A scanning electron micrograph taken at 300× shows CDCs on the large particle sized CPC 3. [Color figure can be viewed in the online issue, which is available at www.interscience.wiley.com.]
