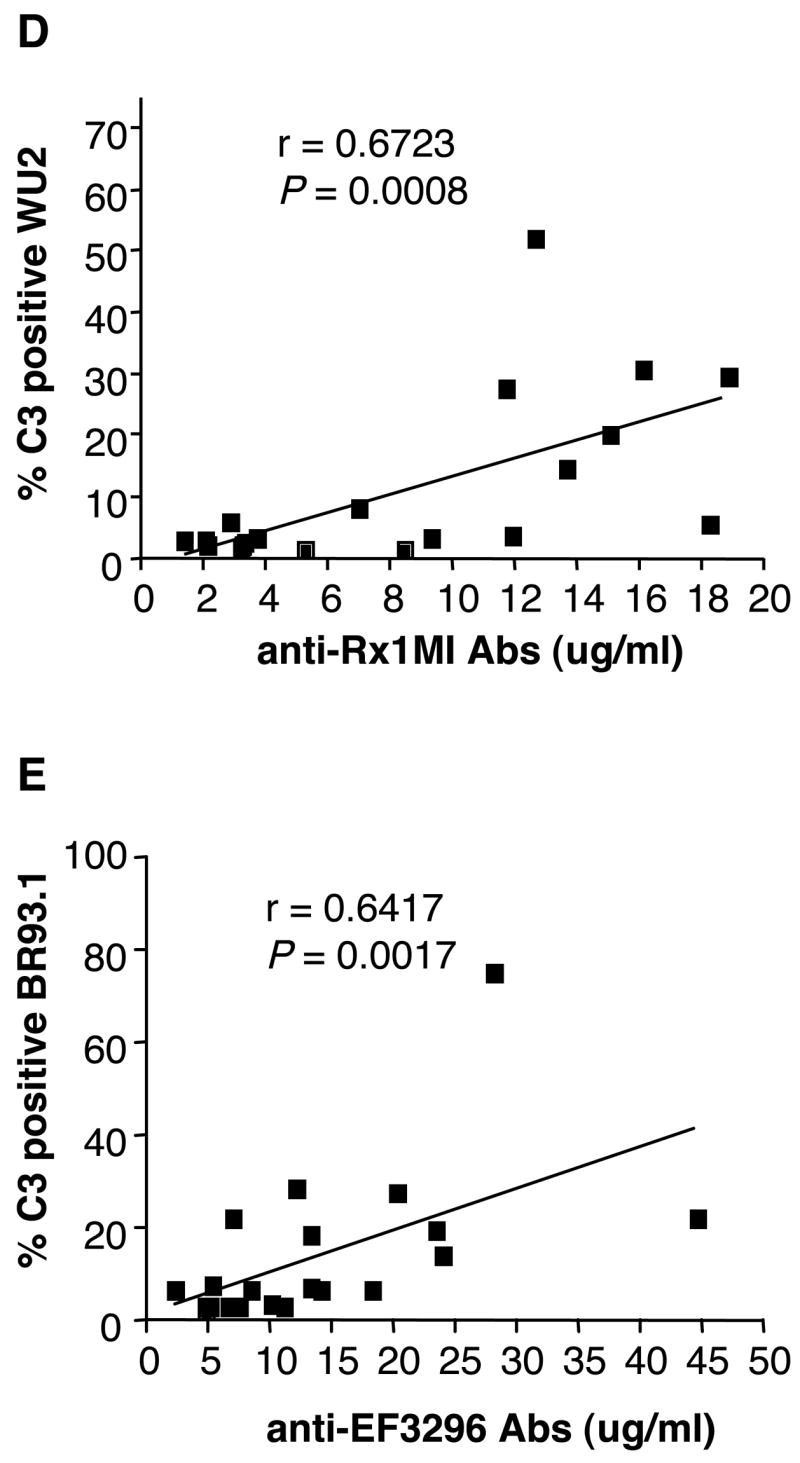
Figure 2.

Correlation of antibody level and C3 deposition. Correlations between the level of anti-Rx1 and C3 deposition on WU2 (A), or anti-EF3296 and C3 deposition on BR93.1 (B) were shown. The nonparametric (Spearman) correlation r-value and two-tailed P value were indicated on the graphs.
