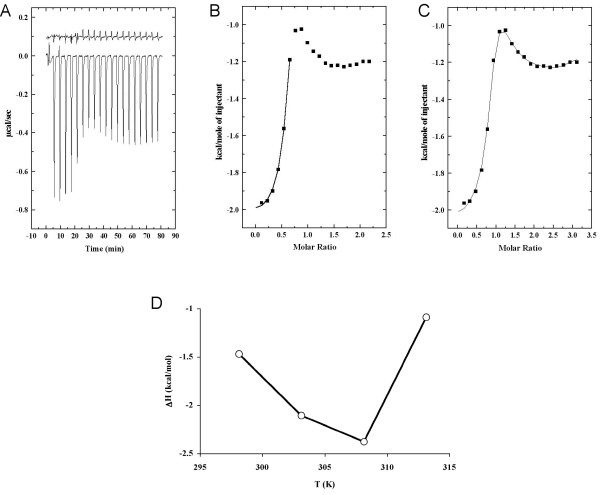
Figure 3.
Isothermal titration calorimetry. A. Titration of the MBP peptide (1 mM) into a solution of CaM (0.1 mM) at +30°C. The results of a control reaction, where the MBP peptide was titrated into buffer at +30°C, are indicated above, moved up by 0.1 μcal/s for clarity. B. Fitting for the specific binding site only. The solid line indicates the non-linear least squares fit for the integrated area under peaks 2–7. The fitting model is one binding site. C. Fitting of all data to a multi-site model. The solid line indicates the non-linear least squares fit for the integrated area under peaks 2–20. The used model is for 4 sequential binding sites. Only the parameters for first binding event were used for analysis. D. The observed enthalpy as a function of temperature. The heat capacity (ΔCp = -0.13 kcal mol-1 K-1) is the slope calculated by using ΔH values at temperatures +25 and +30°C.

