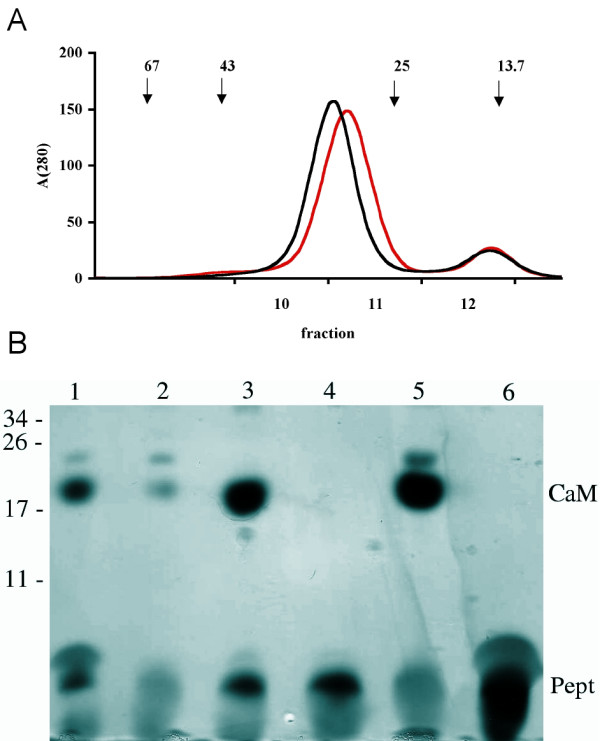
Figure 8.

Gel filtration of CaM in the presence and absence of the MBP peptide. A. The elution profiles of CaM (black) and the complex of CaM and peptide (red) from a Superdex 75 column. The arrows above indicate the elution volumes and molecular weights (in kDa) of the standard proteins used to calibrate the column. The positions of the collected fractions from the complex sample are indicated below the graph. The absorbances have been multiplied by 1000 for clarity. B. Electrophoretic analysis of the fractions obtained from the complex sample on a 16.5-% Tris-tricine peptide gel. The samples are as follows: 1, the CaM-peptide mixture injected into the column; 2, fraction 10; 3, fraction 11; 4, fraction 12; 5, CaM; 6, peptide. The positions of molecular weight markers (in kDa) are indicated on the left, and the positions of CaM and the peptide are indicated on right. Note how the peak fraction (lane 3) contains both CaM and the peptide. A weak low-molecular-weight shadow is also seen in the CaM sample (lane 5), but the peptide stains intensely dark with silver and can unequivocally be detected based on its colour. The faint band above CaM is most likely another conformation of CaM.
