
Fig. 4.
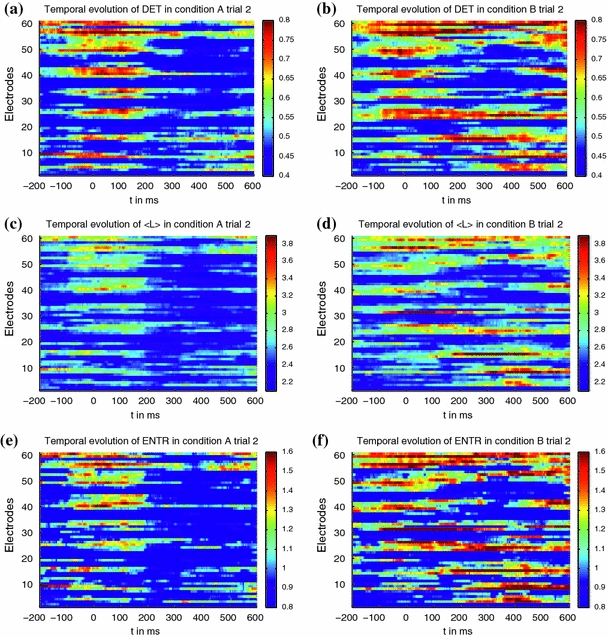
Temporal evolution of chosen RQA measures in condition A and B in a representative trial (trial 2) at all electrode sites. The electrode sites are given in Table 2 in the appendix. In condition B (Fig. 4(b, d, f)) numerous transitions between 300 and 500 ms are found while the control condition A lacks these (Fig.4(a, c, e))