
Fig. 5.
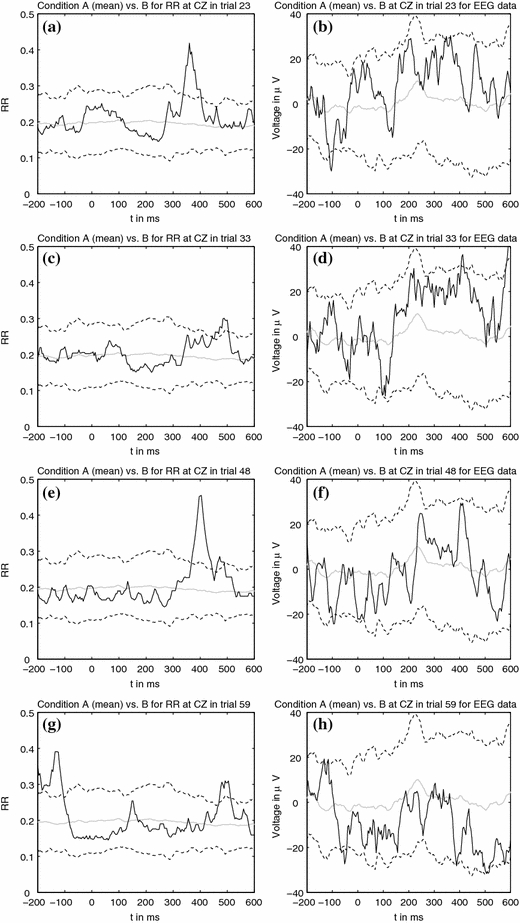
Comparison of single trials (black line) in experimental condition B versus the averaged control condition (grey line) for RR and preprocessed EEG data. The dashed line denotes the 95% CI of the control condition
Official websites use .gov
A
.gov website belongs to an official
government organization in the United States.
Secure .gov websites use HTTPS
A lock (
) or https:// means you've safely
connected to the .gov website. Share sensitive
information only on official, secure websites.
Comparison of single trials (black line) in experimental condition B versus the averaged control condition (grey line) for RR and preprocessed EEG data. The dashed line denotes the 95% CI of the control condition