
Fig. 6.
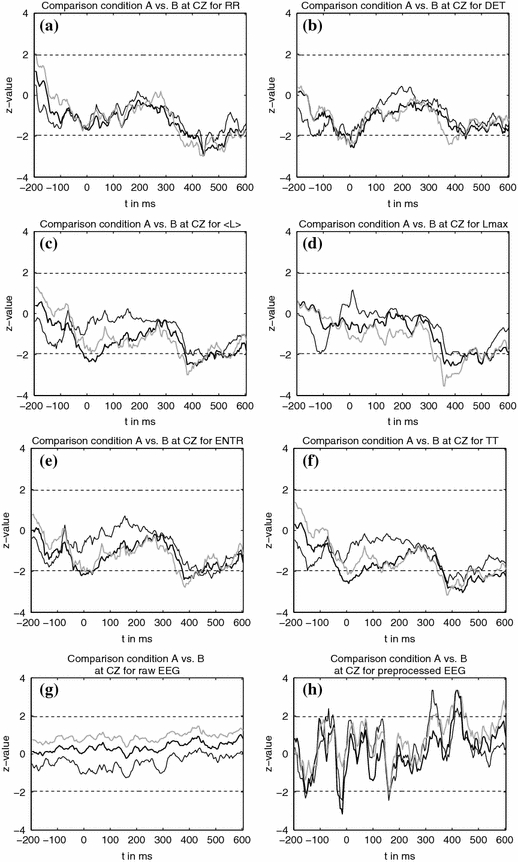
z-value as derived from an MCS of a permutation test for the comparison of condition A and B. The dashed line denotes statistical significance at P = 0.05. The number of trials that entered the analysis were n = 30 (grey line), n = 20 (thick black line) and n = 10 (thin black line)