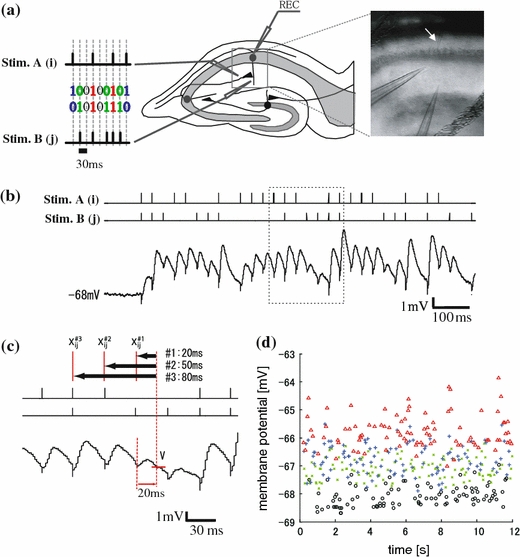
Fig. 1.

Experimental procedure and sample traces. (a) Schematic diagram (left) and IR-DIC image of hippocampal slices (right). Two independent extracellular electrodes were set onto the Schaffer collaterals in hippocampal CA1 areas. There were four input spatial patterns of electrical stimulation: electrical stimulation through both electrodes (“11” (red)), either electrode (“10” (blue) and “01” (green)), and neither electrode (“00” (black)). A random-ordered successive input spatial pattern appears sequentially in 30 ms intervals. The right image indicates IR-DIC image of the hippocampal CA1 areas. The white arrow indicates the recording electrode. The lower two electrodes are stimulation electrodes. (b) Sample traces of membrane potentials recorded from the soma of pyramidal neurons in rat hippocampal CA1 area. The upper two traces indicate the timing of electrical stimulation and the lower trace indicates membrane potentials recorded from neurons. The temporal timing of these traces was adjusted. (c) Schematic diagrams of the representative membrane potential (“amplitude”) and the stimulus patterns in the sequences. Three traces were corresponded to the timing of the rectangle area in (b). Left red vertical dotted line indicates one example of the timing of stimulation. Right dotted vertical line indicates the timing of 20 ms after pattern stimulation. The cross point of right dotted vertical line and red horizontal solid line indicates the representative value of the responses, “amplitude”. The “amplitudes” were classified by the pattern one time-history step (“X#1ij”), by the pattern two step before the sequence (“X#2ij”) and by the pattern three steps before the sequences (“X#3ij”). (d) Stable responses of the amplitudes classified into the four input spatial pattern groups for 12 s. The X-axis indicates recorded-timing (s) during a 12-s sequence of electrical stimulation. The Y-axis indicates amplitude (mV) at the timing of crossing line in (c). The color of plots indicate input spatial pattern; red, blue, green, and black traces indicate membrane potentials induced by the "11", "10", "01", and "00" type of electrical stimulation, respectively
