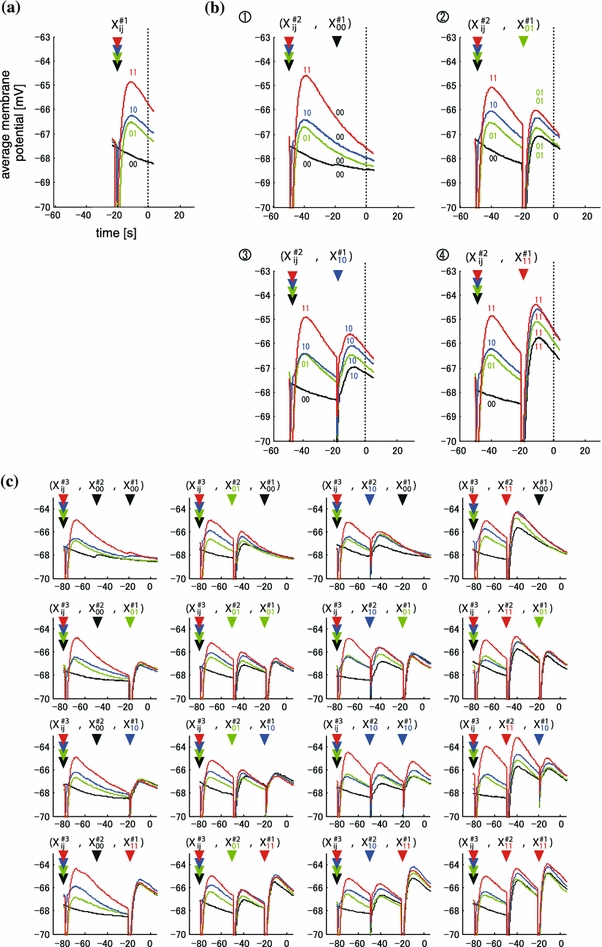
Fig. 2.

Example of time-course of average amplitude of the responses in sub-threshold group. (a) Time course of averaged amplitudes in the four groups, which is classified by the pattern one time- history step. The color of traces indicate spatial stimulation pattern by the 1 time-history step; Red, blue, green, and black traces indicate membrane potentials induced by the spatial pattern of “11”, “10”, “01”, and “00”, respectively. Input spatial pattern was applied at the timing of arrowheads of four colors (X#1ij). Vertical dotted line indicates the timing of represented value of amplitude. The X- and Y-axis indicate time (ms) and membrane potentials (mV), respectively. The timing of amplitudewas defined as 0 ms. (b) Time course of averaged amplitudes in the sixteen groups, which is classified by the pattern two history-steps. Each four traces in (a) was subclassified into four groups by the pattern at two time history step. The four graphs indicate subclassified traces of four spatial patterns: upper left, upper right, lower left, and lower right graph showed subdivided responses of “X#100” (black trace), “X#101” (green trace), “X#110” (blue trace), and “X#111” (red trace) in (a), respectively. In each graph, the color of right arrowhead above the traces indicates the timing and spatial pattern of input. Each trace was subclassified into four traces by the spatial pattern of two time-history steps. The color of the trace indicates the two preceding input temporal pattern: red, blue, green, and black indicate "11", "10", "01", and "00", respectively. (c) Time course of averaged amplitudes in the sixty-four groups, which is classified by the pattern three time-history steps. Each of four traces in (b) was subclassified into four groups by the pattern at three time history steps. The sixteen graphs indicate subclassified traces of four spatial patterns: each four graphs of upper, middle upper, middle lower, and lower row showed subdivided responses of “(X#2ij,X#100)” (upper left graph), “(X#2ij,X#101)” (upper right graph), “(X#2ij,X#110)” (lower left graph), and “(X#2ij,X#111)” (lower right graph) in (b), respectively
