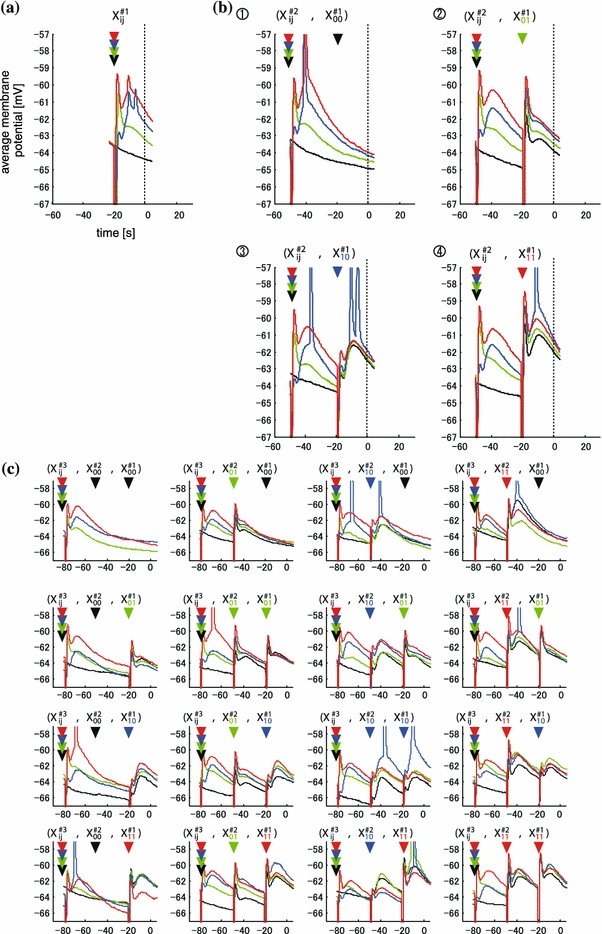
Fig. 3.

Example of time-course of average amplitude of the responses in supra-threshold group. The relationships among the graphs are consistent with those in Fig.2a–c. Time course of averaged amplitudes in the four (a), sixteen (b), and sixty-four groups (c), which is classified by the pattern one (a), two (b), and three (c) time-history steps sequences, respectively
