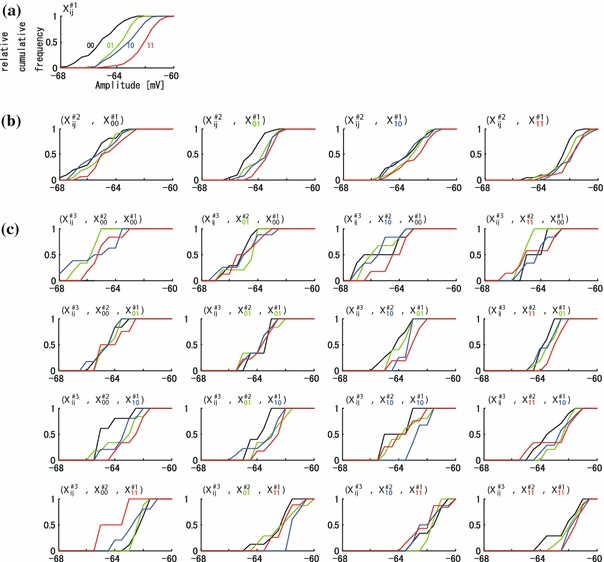
Fig. 5.

An example of distribution of membrane potentials by one, two, and three time-history steps in supra-threshold group. The relationship of the graphs is consistent with those in Fig. 4a–c. One (a), four (b), and sixteen (c) SCH histograms of amplitudes subclassified by one (a), two (b), and three (c) time-history steps, respectively
