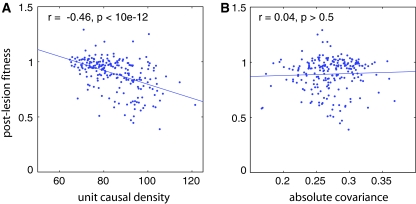
Fig. 3.
Post-lesion fitness following lesions to INs as a proportion of the fitness of the intact network, plotted against (a) mean unit causal density of the IN and (b) mean absolute covariance of the IN with the remainder of the network (see text). Each panel shows Pearson’s correlation coefficient (r) as well as the corresponding p-value.

