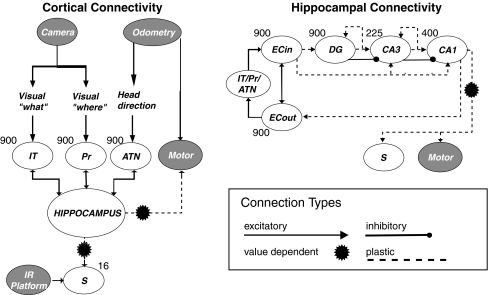
Fig. 4.
Schematic of Darwin X’s simulated nervous system. There were two visual input streams responding to the color (IT), and width (Pr), of visual landmarks on the walls, as well as one odometric input signalling Darwin X’s heading (ATN). These inputs were reciprocally connected with the hippocampus which included ‘entorhinal’ cortical areas ECin and ECout, ‘dentate gyrus’ DG, and the CA3 and CA1 hippocampal subfields. The number of simulated neuronal units in each area is indicated adjacent to each area. This figure is reprinted with permission from Seth and Edelman (2007)

