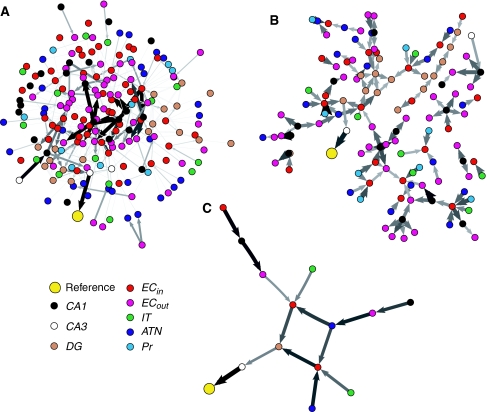
Fig. 7.
(a) The context network for a representative NR in Darwin X. The thickness of each line (and size of each arrowhead) is determined by the product of synaptic strength and the activity of the presynaptic neuron. (b) The corresponding Granger network. Line thickness here reflects magnitude of the corresponding causal interaction. (c) The corresponding causal core. Networks were visualized using the Pajek program (http://vlado.fmf.uni-lj.si/pub/networks/pajek/), which implements the Kamada-Kawai energy minimization algorithm. Color online

