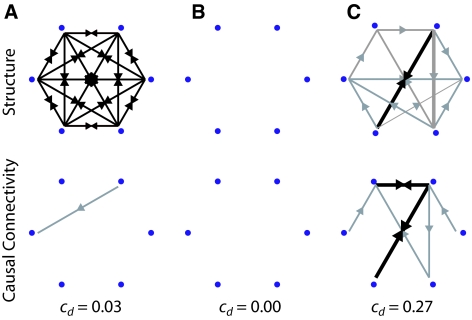
Fig. 9.
Example simple networks (top row) and corresponding causal connectivity patterns (bottom row). (a) Fully connected network. (b) Fully disconnected network. (c) Randomly connected network. Grey arrows show unidirectional connections and black arrows show bidirectional connections. The width of each arrow (and size of arrowhead) reflect the magnitude of the causal interaction. Corresponding values of causal density (cd) are also given

