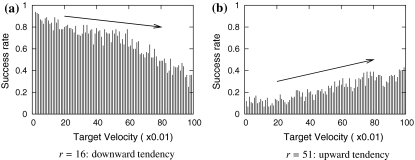
Fig. 12.
Success rates drawn from Fig. 11. We take the data of a certain connectivity and show them in two dimension diagram. The horizontal axis represents target velocity from 0.01 to 1.0, and the vertical axis represents success rate. With the increase of target velocity, (a) r = 16: downward tendency; (b) r = 51: upward tendency

