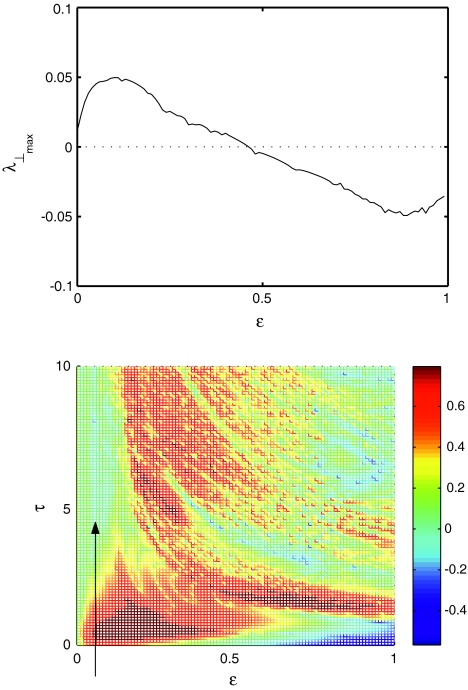
Fig. 4.
Stability diagram. On the top, the value of the largest transverse Lyapunov exponent of a two neuron network is plotted as a function of coupling strength and no time delay, τ = 0. Below, the stability diagram is shown as a function of coupling and time delay. The arrow points at a region of negative Lyapunov exponents for small coupling and non-zero time delay

