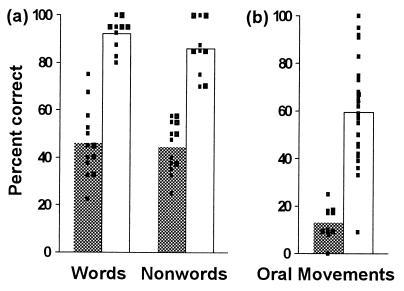
Figure 2.
(a) Word and nonword repetition. Bars indicate mean percent correct for the groups of affected and unaffected family members (n = 13 and 10, respectively). Filled bars, affected group; open bars, unaffected group; small squares, scores of individual family members. Note the absence of overlap between the scores of the two groups on both tests. (b) Simultaneous and sequential orofacial movements to command. Bars indicate mean percent correct for the group of affected family members and the normal control group (n = 11 and 52, respectively). Filled bar, affected group; open bar, control group; small squares, scores of individuals (for clarity, the same score obtained by two or more control subjects is marked by a single square). Again note the absence of overlap between the scores of the two groups, except for one statistical outlier (a 45-year-old male) in the control group.

