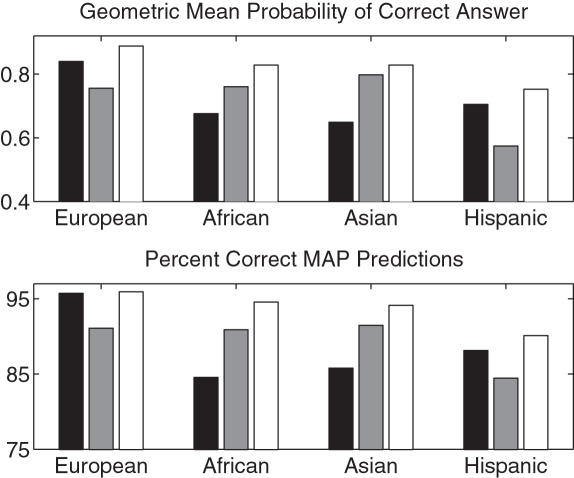
Figure 5. Locus-Specific Predictive Accuracy.
Each set of grouped bars, from darkest to lightest, represents, respectively, A-masking, B-masking, and C-masking. The number of masked alleles in each masking was 3012, 1418, 528, and 354, respectively, for the European, African, Asian, and Hispanic test sets.

