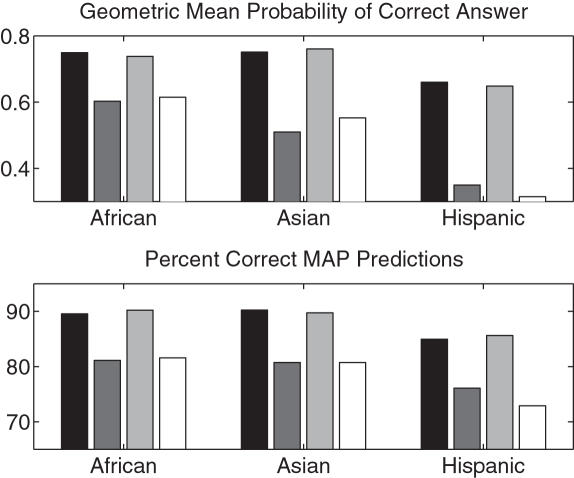
Figure 6. Low Resolution Prediction.
Each set of grouped bars represents, from darkest to lightest, respectively, 100% mask with softmax model, 100% mask with allele marginals model, 30% mask with softmax model, 30% mask with allele marginals model. The number of masked alleles for the 100% mask was 4254, 1429, and 1062, and for the 30% mask, 1287, 477, and 306, in the African, Asian, and Hispanic test sets, respectively.

