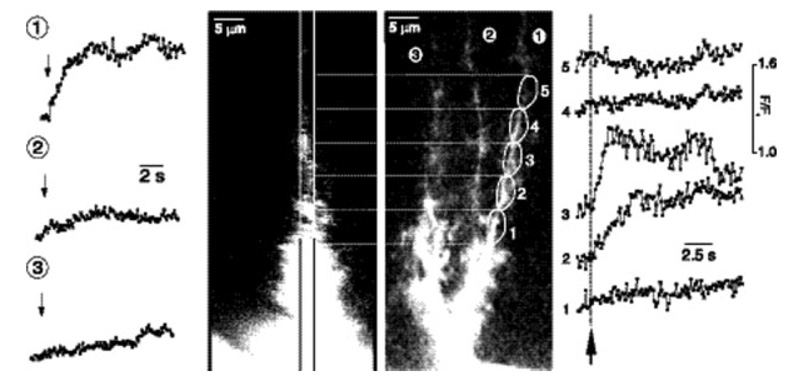
Fig. 2.
Activity-evoked Ca2+ signaling in Bergmann glial cells. Calcium fluorescence measured in three cell processes of a Bergmann glial cell following electrical stimulation of parallel fibers. Stimulation evokes a Ca2+ increase in process 1 but not in processes 2 and 3 (traces on the left). Within process 1, microdomains 2 and 3, but not 1, 4 or 5, display stimulus-evoked Ca2+ increases (traces on the right). The right hand image shows the Bergmann glial cell from which the measurements were made. From (Grosche et al., 1999).

