
Fig. 4.
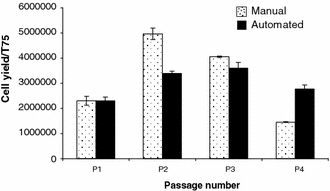
hMSC yield per T175 flask at each passage from cells grown using an automated or manual protocol (sample 2). Growth profiles differ between protocols. Error bars show the standard error of the mean. Automated culture (n = 8), manual culture (n = 4)