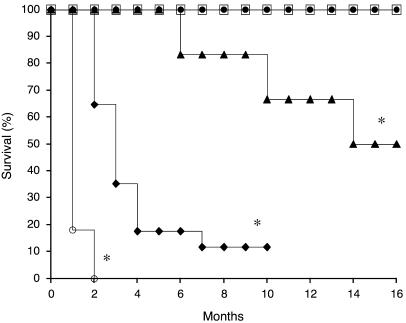
Figure 4. Expression of high mFVIIa levels is associated with increased mortality after crossing the founder C57BL/6–SJL mice into C57BL/6 pure strain background.
Kaplan-Meier survival plot of transgenic mFVIIa mice with low or high levels of transgene expression compared with WT littermates. Curves for high mFVIIa expressers exclude animals dying within 72 h of birth. Squares, WT (n = 10); filled circles, low-mFVIIa N1–N4 (n = 25); triangles, high-mFVIIa F0 (n = 6); diamonds, high-mFVIIa N1 (n = 17); open circles, high-mFVIIa N2 (n = 11). *P < 0.05 versus WT.

