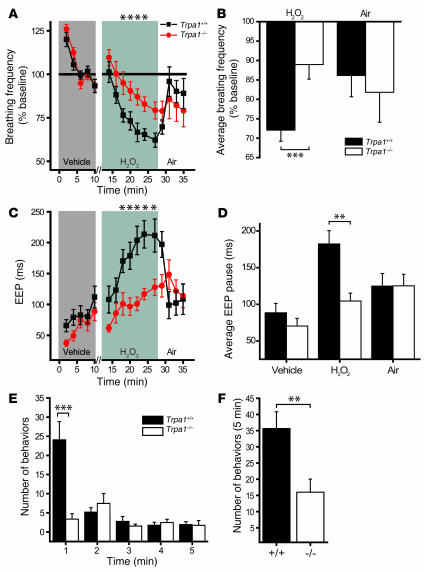
Figure 6. Reduced respiratory and nociceptive sensitivity of Trpa1–/– mice to H2O2.
(A) Change in respiratory frequency during aerosol exposure to PBS and 3% H2O2, as measured by unrestrained plethysmography. Mice were exposed to vehicle aerosol (10 min), room air flush (2 min), H2O2 aerosol (15 min), and then air (8 min). Values denote percent baseline (initial vehicle exposure). Both groups showed a significant decrease in respiratory frequency during H2O2 exposure compared with vehicle; however, the reduction in Trpa1+/+ mice was significantly greater. P < 0.005 between groups; P < 0.000001 over time (repeated-measures ANOVA). (B) Changes in respiratory frequency after exposure to H2O2 (2–15 min) and air (8 min) as in A. Values denote percent baseline (initial vehicle exposure). (C) Changes in EEP duration during exposure to H2O2 aerosol as in A. P < 0.001 between groups; P < 0.000001 over time (repeated-measures ANOVA). Single asterisks denote significant differences (Bonferroni post-hoc analysis; α = 0.05) for individual time points in A and C. (D) Change in EEP over duration of exposure to vehicle (2–10 min), H2O2 (2–15 min), and air (8 min). (E) Nocifensive responses following paw injection of 25 μl of 0.1% H2O2 solution (32 mM). The number of nocifensive responses (paw flicks, licks, and lifts) was averaged in 1-min intervals. (F) Pain responses accumulated over a 5-min period following injection of H2O2 as in E. (A–D) n = 14 per group. (E and F) n = 12 (Trpa1+/+), 11 (Trpa1–/–). Error bars denote SEM. **P < 0.01; ***P < 0.001 (ANOVA).

