
Figure 6.
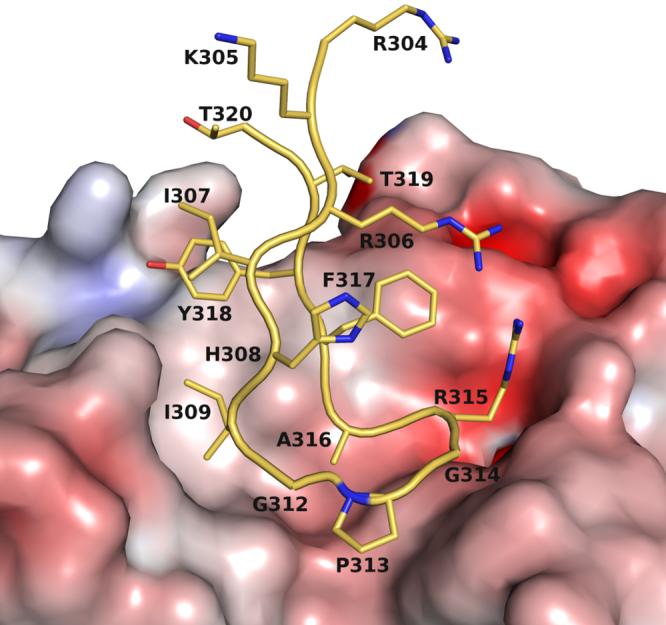
Molecular surface representation of the antigen-binding pocket colored by electrostatic potential, calculated in APBS63, and mapped onto the surface with the color code ranging from -10 kT/e (bright red) to +10 kT/e (dark blue). IleP309 is accommodated in a hydrophobic pocket, whereas ArgP315 forms a salt bridge with AspL92.