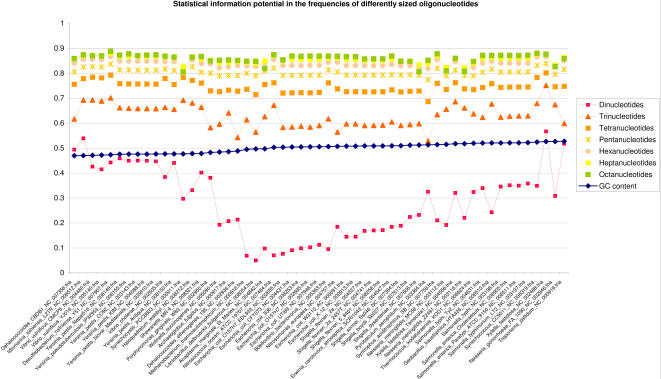
Figure 1. Statistical information potential in differently sized oligonucleotides.
Cumulative information potential is measured in di- to octanucleotide frequencies in prokaryotic genomes with GC content between 47% and 53%. These genomes were selected because of the increased sensitivity of the Pearson correlation measure for chromosomes with similar AT/GC content. The archaeal and bacterial chromosomes are represented along the horizontal axis, sorted by increasing GC content from left to right, with corresponding correlation scores between observed n-mer words and approximated n-mer words on the vertical axis. The n-mer words were approximated by observed (n–1)-mer words and genomic nucleotide frequencies. High correlation scores indicate increased similarity between observed and approximated oligonucleotide usage.

