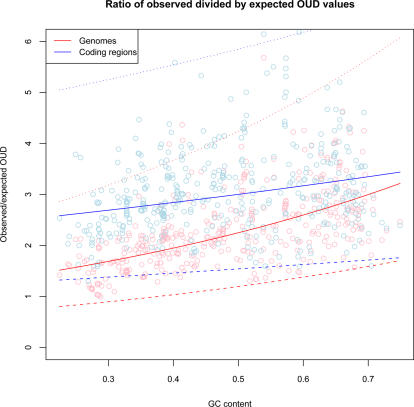
Figure 5. Ratio of observed divided by expected OUD values.
The vertical axis shows the ratio of observed divided by expected OUD values for each chromosome sorted with respect to genomic GC content from left to right on the horizontal axis. The ratio test measures how observed oligonucleotide usage varies within chromosomes (red line) and coding regions (blue line) compared with expected based on GC content. Rising ratio values above 1 (vertical axis) means increased observed variance compared with expected. The dotted lines represent 99% prediction intervals.

