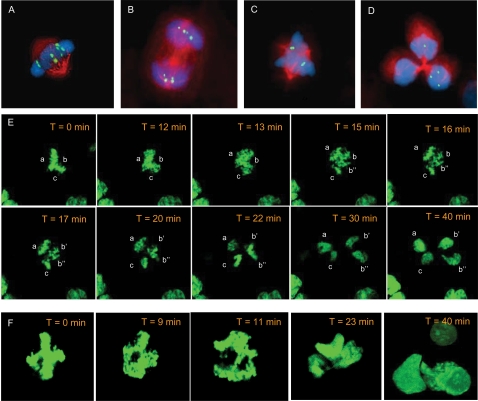
Figure 1. Chromosome dynamics.
A chromosome 12 specific alpha-satellite probe (green) combined with immunofluorescence for beta tubulin (red) and DNA-counterstaining by DAPI (blue) shows tetrasomic/bipolar cell division at metaphase/early anaphase (A) and late anaphase (B) and a disomic/tripolar cell division at metaphase (C) and telophase (D); the segregation pattern is 4-4 in (B) and 3-1-0 in (D). Time-lapse microscopy of H2B/GFP transfected HEK293 cells shows succession of a tripolar metaphase configuration (E; poles denoted a-c) through two successive chromosome segregation events to four daughter nuclei and from a tetrapolar metaphase configuration (F) through a tripolar ana-telophase to three daughter nuclei shown by three-dimensional reconstruction of a confocal image stack at T = 40 min (T, time from first image).

