
FIGURE 5.
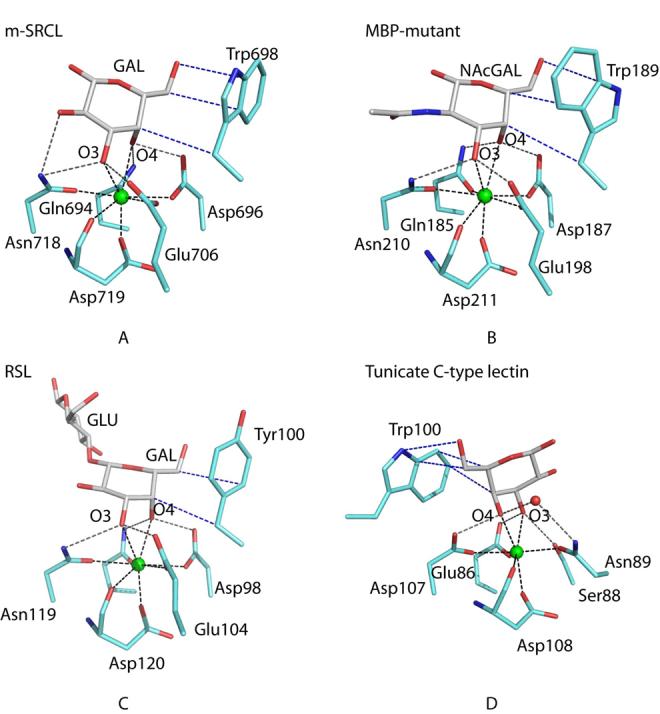
Comparison of galactose-binding sites in C-type CRDs. Carbon, nitrogen, oxygen, and calcium are represented as white, blue, red, and green spheres, respectively. Hydrogen bonds are shown as dashed gray lines, Ca2+ coordination bonds are dashed black lines and hydrophobic interactions are in dashed blue lines. a, mouse SRCL. For simplicity only the galactose residue of Lewisx is shown. b, Gal/GalNAc-binding mutant of mannose-binding protein complexed with GalNAc (1FIH, copy A) (16). c, Rattlesnake venom lectin complexed with lactose (1JZN) (17). d, Tunicate lectin complexed with galactose (1TLG) (18).