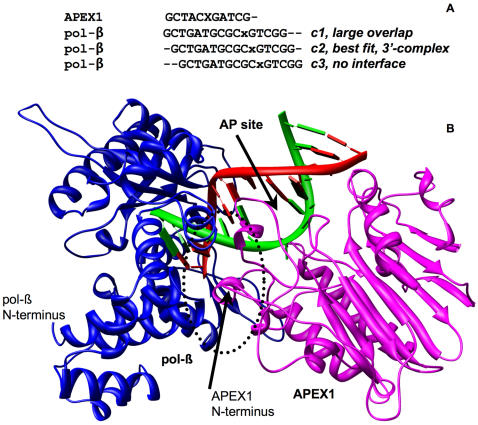
Figure 2. Initial 3′ complex of APEX1 and pol-β (closed conformation).
(A) Alignment of DNAs co-crystallized with pol-β and APEX1. X stands for the abasic site and x stands for lesion. Notations c1, c2, and c3 mark the alignments used to produce three initial complexes. (B) View of the 3′ complex structure. APEX1 is on the right and pol-β is on the left. The area of protein-protein interaction is circled.

