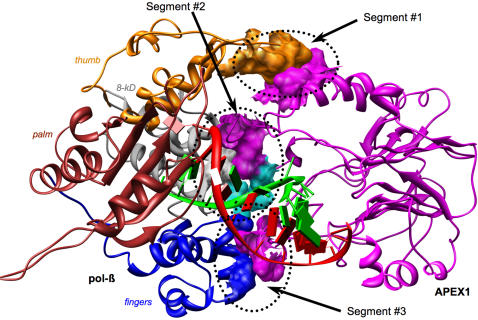
Figure 3. The interface of APEX1 and pol-β (closed conformation) in 3′ complex after 0.2 ns of MD simulation.
The initial complex is shown in Figure 2. Subdomains of pol-β are colored by different colors and named. The protein-protein interface consists of three spatially distinct segments. Residues with correlated mutations (for segment #2: Arg221 of APEX1 and Gln31 of pol-β) are colored in cyan (see also Figure 6).

