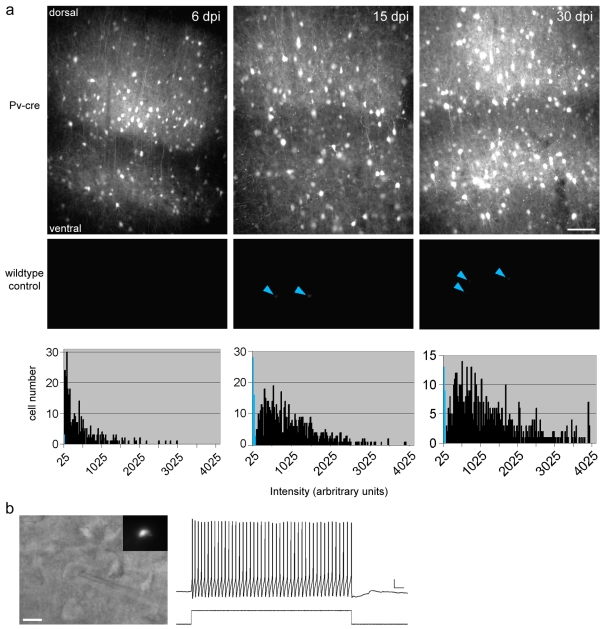
Figure 2. GFP expression in Pv-cre mice injected with AAV-LS1L-GFP is stable for months.
(a) Pv-cre mice (top row; n = 3 mice for each time point) and wildtype control mice (middle row; n = 3 mice for each time point) were injected with AAV-LS1L-GFP and were perfused at 6,15,30, and 60 days post-injection (dpi). See Figure S3 for 60 dpi. All epi-fluorescence images were acquired with a CCD camera using the same acquisition parameters. The maximum exposure time that did not lead to saturation of signal was used (75 ms), and the same look-up table was applied to all of the images shown. GFP expression levels increased with time in Pv-cre mice. Under these conditions, sparse weak signals were detected in some wildtype control mice (blue arrowheads); scale bar, 100 µm. Bottom row, quantification of GFP intensity at somata of labeled neurons plotted for wildtype control mice (blue) and Pv-cre mice (black). Average number of GFP+ cells counted per animal in Pv-cre injected animals was (6,15,30 dpi): 110+/−34, 215.3+/−34, 195.3+/−26 cells. (b) Whole cell current clamp recording of an AAV-LS1L-GFP-transfected neuron from a 2.5 month-old Pv-cre mouse at 20 dpi. Left, DIC image of recorded cell; inset shows GFP fluorescence; scale bar, 10 µm. Right, example trace of spikes in response to a 250 pA current step; scale bar, 10 mV, 25 ms.

