Figure 1.
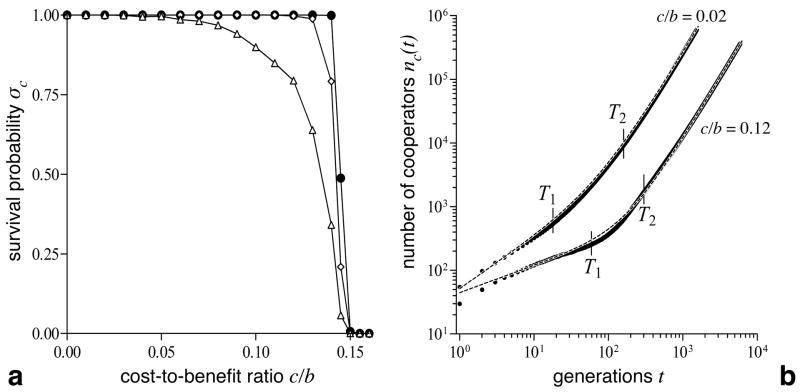
Survival probability σC and growth characteristics of invading cooperators. a For initial cluster sizes of s × s with s ≥ 3, the survival probability is close to 1 and essentially independent of s (Δ, s = 3; ⋄, s = 5; •, s = 15) and the cost-to-benefit ratio c/b up to the extinction threshold λ ≈ 0.15, where cooperators can no longer survive irrespective of their initial abundance. σC is determined over 1000 runs on a 115 × 115 lattice and cooperators are assumed to survive if they reached the boundary. b The growth of the number of cooperators nc(t) displays two distinct regimes: A first phase of slow growth that corresponds to a local equilibration process of the initial cluster, followed by a second phase representing the expansion of cooperators. Both regimes follow a power function of the form nc(t) = aitdI but with distinct growth exponents (d1 < 1 in the first phase and d2 ≈ 2 in the second phase; see Table 1). The dashed line shows the superposition of the two fits nc(t) = a1td1 + a2td2. Vertical lines mark the end of the first (T1)and the beginning of the second growth phase (T2) as used for fitting the power function. The expansion process is shown for a 30 × 30 cluster on a 10002 lattice averaged over 100 runs.

