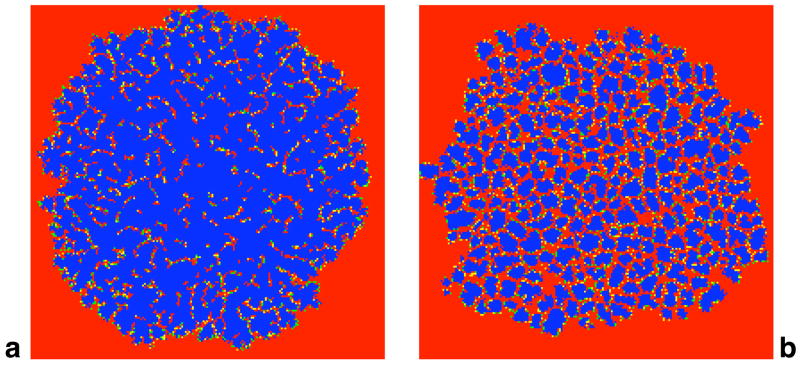
Figure 2.
Typical snapshots of the invasion of cooperators (blue) in a world of defectors (red) for a small cost-to-benefit ratio (c/b = 0.02) and b for c/b closer to the extinction threshold (c/b = 0.12). Along the interface separating cooperators and defectors, some individuals recently switched from defection to cooperation (green) or vice versa (yellow). a Cooperators expand as a single contiguous cluster with embedded specks of defectors, and a few isolated tiny cooperator formations along the invasion front. In this snapshot there is one large cluster of size 23187 accompanied by 14 single, isolated cooperators and the average weighted cluster shape is γ = 0.078. The fraction of cooperators is fc = 0.58 and qc\c = 0.89. b Cooperators form numerous small compact clusters. There are 143 clusters ranging from a single cooperator to a cluster of size 1987, with a weighted average size of 537 and shape γ = 0.356. The fraction of cooperators is fc = 0.37 and qc\c = 0.76. The snapshots are shown for an initial 15 × 15 cluster on a 2002 lattice and can be reproduced using the VirtualLabs (Hauert, 2006b).

