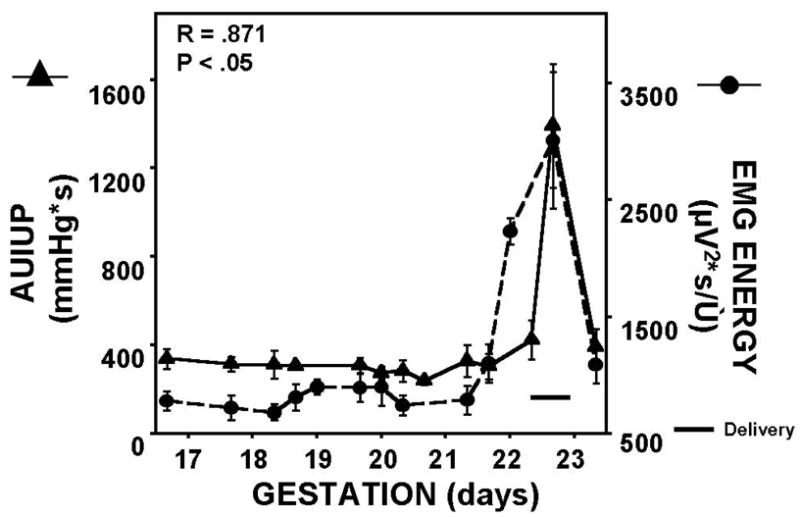
Figure 2. Changes in, and Correlation of, Area Under Intrauterine Pressure Curve and Uterine EMG Burst Energy for Term-Delivering Animals.

For term-laboring rats, delivery occurred on approximately day 22, with both uterine EMG energy and AUIUP increasing dramatically just prior to and during active labor and subsequent delivery. Delivery for each particular animal took only about 2–3 hours. Correlation coefficient, and corresponding P-value, for the two parameters are shown. Pearson product-moment was used for correlation.
