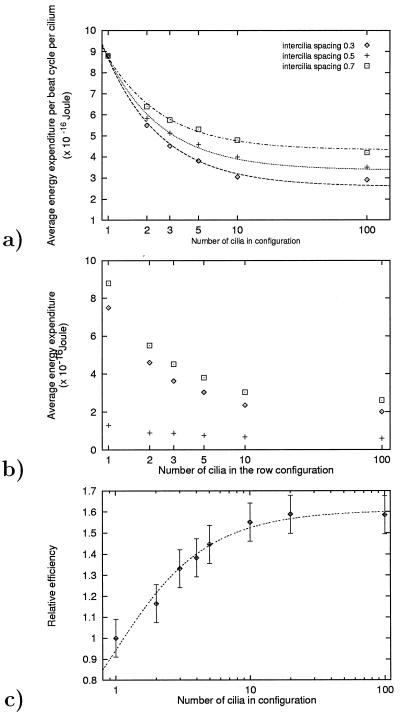
Figure 2.
(a) The average per-cilium energy expenditure during the beat cycle, as a function of the number of cilia in multicilia configurations. The interciliary spacing is 0.3, 0.5, and 0.7 ciliary length. The horizontal axis is a logarithmic scale. The computations are done for the viscosity of water. (b) The average energy spent per cilium per cycle in multicilia configurations. Results for configurations of 1, 2, 3, 5, 10, and 100 cilia are shown. The interciliary spacing is 0.3 ciliary lengths. The computations are done for the viscosity of water. The horizontal axis displayed is a logarithmic scale. The diamond, plus, and square symbols represent the effective stroke, the recovery stroke, and the whole beat cycle, respectively. The average number of moles of ATP hydrolyzed, and of the number of dynein arm attachments are indicated by the same symbols, but the units of the ordinate would be 0–16−20 moles and 0–10,000 attachments, respectively. (c) The relative efficiency of fluid propulsion, as a function of the number of the cilia in the row. Efficiency is defined here as the net fluid mass moved in the direction of the effective stroke through a test area near the ciliary array, per unit of spent energy (see explanation in text). The results are scaled with respect to those obtained for a single cilium. The horizontal axis displayed is a logarithmic scale.

