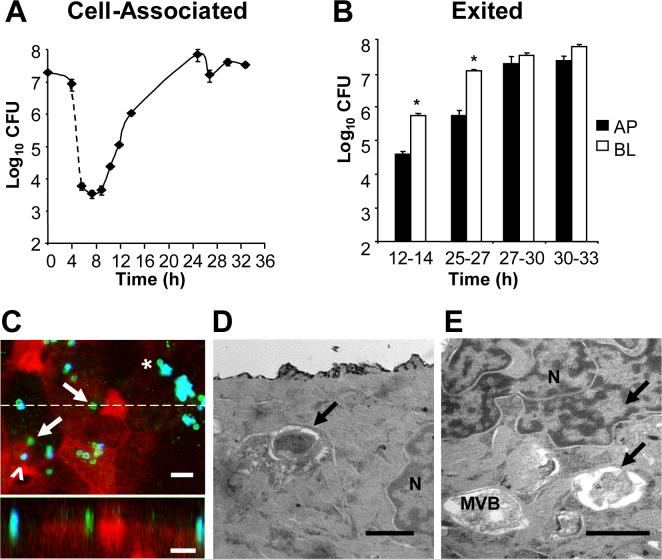
Figure 1. Profile of Gc infection of polarized T84 cells.
Panel A: Cell-associated Gc. Polarized monolayers of 106 T84 cells were apically infected in triplicate with P+ FA1090 Gc for 4 h, then treated with gentamicin for 2 h (dotted line). At the indicated times, T84 lysates were serially diluted and plated for colony-forming units (CFU). The average number of CFU ± standard error of the mean (SEM) for three replicate monolayers per time point is presented. Panel B: Exited Gc. At the indicated intervals, the apical (AP; black bars) and basal (BL; white bars) medium was removed from infected T84 cells and CFU enumerated from each. *, P < 0.01 between apical and basal CFU in the specified interval (Student's t-test). Panel C: Gc are detected within T84 cells. T84 cells were fixed at 12 h post-infection and intracellular and extracellular Gc were discriminated from one another by differential antibody accessibility and examined by confocal laser scanning miscroscopy. Green, intracellular Gc; turquoise (blue + green), extracellular Gc; epithelial F-actin, red. In the top image, arrows point to two intracellular bacteria, one of which is adjacent to an extracellular bacterium (arrowhead). Asterisk denotes a potentially intracellular bacterium at the edge of a microcolony. In the bottom image, an X-Z section was taken through the slice indicated in the top image by the dotted line and shows an internalized, subapical bacterium in the middle of the field, flanked by two apically adherent, extracellular bacteria. Scale bars, 5 μm. Panels D-E: Gc reside within vacuoles in T84 cells. T84 cells were fixed at 12 h post-infection and processed for thin-section transmission electron microscopy. Arrows indicate intracellular bacteria; N, nucleus; MVB, multivesicular body. Scale bars, 1 μm.

