
Figure 2. P− Gc variants arise from a P+ progenitor during T84 cell infection.
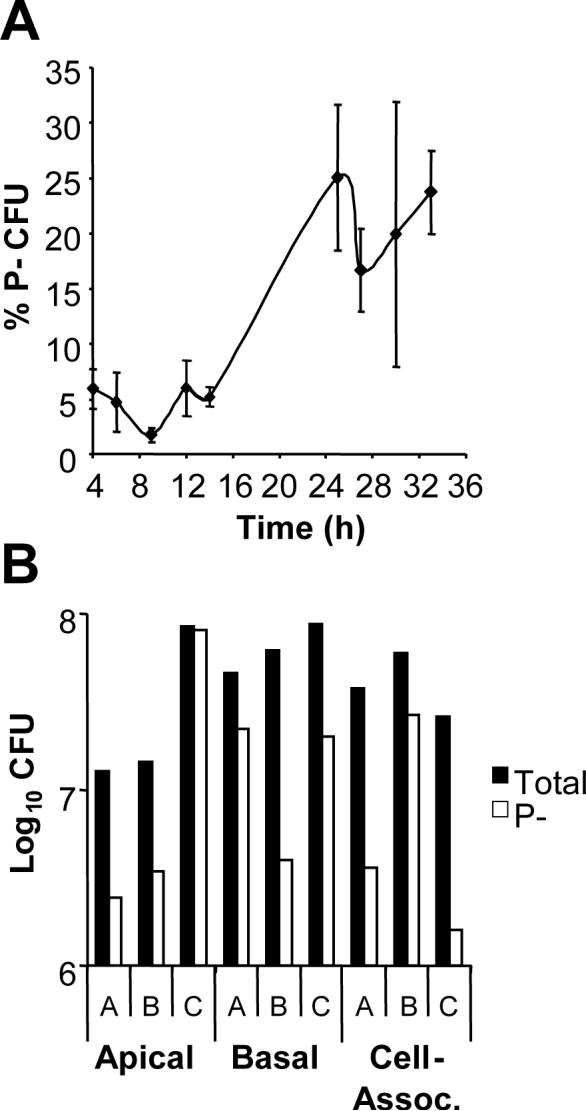
Panel A: Percentage of cell-associated P− CFU. The pilus-dependent colony morphology of CFU arising over time in T84 cells infected with P+ FA1090 Gc was examined using a stereomicroscope. The average percentage of P− CFU ± SEM was determined for three replicate monolayers per time point. Panel B: P− Gc arise stochastically during epithelial infection. Three monolayers of T84 cells, denoted A-C, were infected with P+ FA1090. The P+ (black bars) and P− (white bars) CFU present in the cell-associated population of each monolayer at 30 h and entering the apical and basal medium from each monolayer between 27 and 30 h were enumerated as in Figs. 1A and B.