
Figure 5. Extensive pilin antigenic variation occurs in Gc associated with T84 cells.
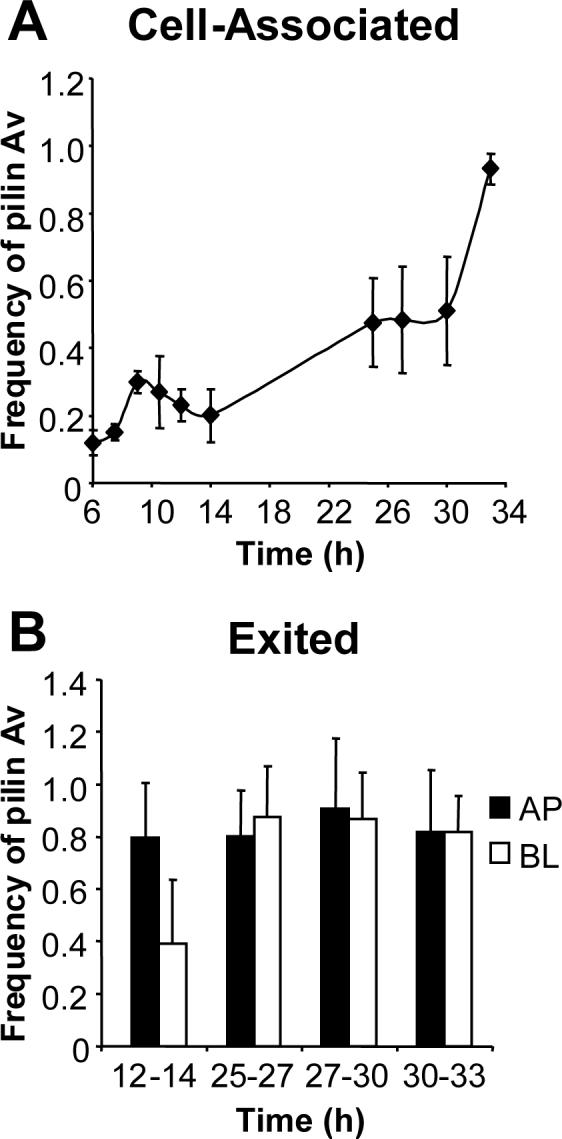
Panel A: Cell-associated CFU. T84 cells were infected with P+ FA1090, and CFU of varying pilus-dependent morphologies were collected from cell lysates. Panel B: Exited CFU. CFU were collected from the apical (AP; black bars) and basal (BL; white bars) medium of infected T84 cells at the indicated intervals. The pilE genes of the collected CFU were amplified, sequenced, and examined for changes from the parental 1−81-S2 sequence. The frequency of pilin Av at each time point or interval is defined as the number of recombination events detected divided by the number of pilE genes sequenced. The frequency was measured separately for the P+ and PCFU in each population, and the overall frequency of pilin Av was calculated by the formula: Frequency = (Frequency P+)(% P+ CFU) + (Frequency P−)(% P− CFU). Data are presented as the average frequency of pilin Av ± SEM measured in triplicate T84 cell monolayers. From the data in Table 1, the actual frequency of pilin Av at each time point is approximately 55% of the reported values.