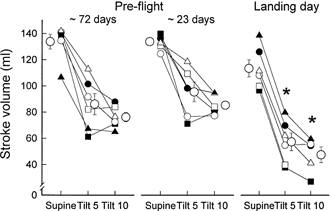
Figure 1. Left ventricular stroke volume responses to 60 deg upright tilt.

Average (± s.e.m.) and individual stroke volumes in the supine position and after 5 and 10 min 60 deg upright tilt (Tilt 5 and Tilt 10). In this and subsequent figures, s.e.m. bars appear to be missing for some points because of the tight data and small s.e.m. Each astronaut is represented by the same symbols in all figures, in this and the other two Neurolab articles (Cox et al. 2002; Ertl et al. 2002). Astronauts 1–6 are represented by ○, □, ▵, •, ▪ and ▴. *P < 0.05 compared with same time points pre-flight. Although all six subjects completed 10 min of tilting, there was a technical problem with the cardiac output measurement for astronaut 2 (□) at 10 min, and no stroke volume measurement was made.
