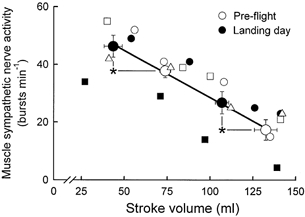
Figure 7. Muscle sympathetic nerve burst frequency plotted as a function of left ventricular stroke volume.

Average measurements (± s.e.m.) made during pre-flight sessions are shown as large open circles and average measurements made on landing day are shown as filled circles. The r2 for linear regression of average data (thick line) was 0.99. Symbols for individual astronauts are the same as in the other figures. r2 values for individual astronauts ranged between 0.91 and 1.00. *P < 0.05 for comparisons between pre- and postflight muscle sympathetic nerve activities and stroke volumes.
