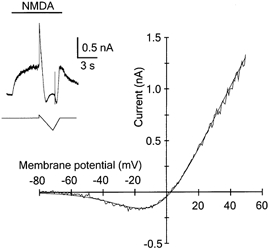
Figure 4. Voltage dependence of Mg2+ block of NMDA receptor channels activated during agonist application in an axotomised motoneuron.

Examples of a current-voltage curve measured by a voltage ramp during a steady-state response to focal application of NMDA in the presence of 1 mm Mg2+. The inset shows the difference in the current induced by NMDA (30 μm) and whole-cell current induced in the absence of NMDA prior to, during and after the holding potential (+30 mV) of a motoneuron (PND 8) was ramped from +60 to −80 mV. Horizontal bar indicates the duration of NMDA application. The continuous line in the I–V relation was obtained by fitting a Boltzmann equation (see Methods for details) to the experimental data. The calculated apparent Kd for Mg2+ binding to NMDA receptor channels at 0 mV was 1.4 mm.
