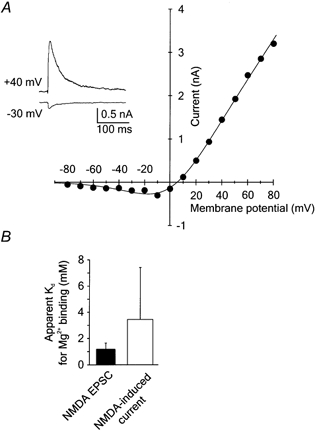
Figure 5. Voltage dependence of Mg2+ block of NMDA receptor channels activated during synaptic transmission.

A, examples of NMDA receptor EPSCs recorded in the presence of 1 mm Mg2+ and 5 μm CNQX at holding potentials of −30 and +40 mV. Four records were averaged in each case. Peak NMDA receptor EPSCs were plotted versus the membrane potential. The continuous line in the I–V relation was obtained by fitting eqn (1) (see Methods) to the experimental data. The calculated apparent Kd for Mg2+ binding to synaptically activated NMDA receptor channels at 0 mV was 1.1 mm. B, bar graph shows the means ±s.d. of the apparent Kd for Mg2+ binding to synaptically activated NMDA receptors (NMDA EPSC) and receptors activated by focal NMDA application (NMDA-induced current). The difference between the apparent Kd for Mg2+ binding to NMDA receptor channels activated during synaptic transmission (n = 8) and by focal NMDA application (n = 14) was not statistically significant (Mann-Whitney rank sum test; P = 0.08).
