
Figure 2. Normalized step response of RVR in response to normal, reduced and elevated levels of angiotensin II (ANGII).
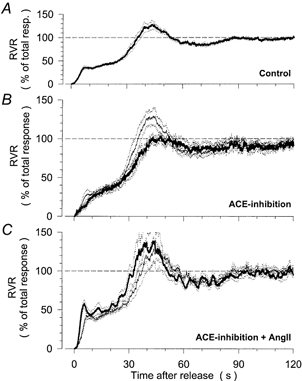
Averaged time course of RVR after release from a reduction of renal artery pressure to 50 mmHg for 60 s. Time = 0 s corresponds to the time of release from the pressure reduction. Values are normalized to the total RVR response between the baseline level before the pressure reduction (100 %) and the minimum level immediately after release (0 %). Mean (continuous traces) ± s.e.m. (dotted traces). A, pooled control response from all 16 control experiments. B, response during control conditions (thin line) and after inhibition of endogenous ANGII formation by ramipril (thick line) in 8 dogs. C, response during control conditions (thin line) and during elevation of plasma ANGII above the resting level by chronic ANGII infusion (5 ng kg−1 min−1) after ramipril treatment (thick line) in 8 dogs.