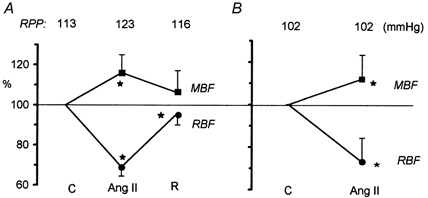
Figure 1. Effect of i.v. Ang II infusion (30 ng kg−1 min−1) on total RBF and renal MBF (LD flux).

The RPP was allowed to increase (A, n = 8) or was maintained constant at 102 ± 1 mmHg (B, n = 39 for RBF and n = 31 for MBF). Data are presented as means ± s.d. as a percentage of the initial control value. C, control; R, post-Ang II recovery. *P < 0.05 or less versus control.
