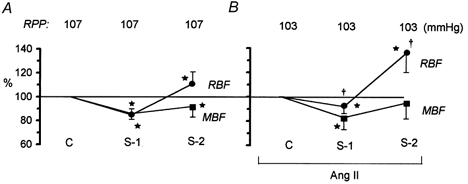
Figure 4. Biphasic effect of i.v. saralasin (S, 3 μg kg−1 min−1) on total RBF and MBF.

A, data recorded with Ang II vehicle (n = 13). B, data recorded with background Ang II infusion, 30 ng kg−1 min−1i.v. (n = 17). The RPP was maintained constant. S-1, S-2, early and final effects of saralasin, respectively. Means ± s.d. for values expressed as a percentage of the pre-saralasin control value (C). *P < 0.05 or less versus pre-saralasin control. †P < 0.002 or less versus the change in the corresponding value measured without background Ang II infusion (A).
