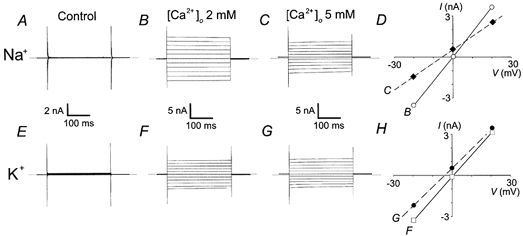
Figure 3. Relative cationic permeability of Imtx.

Representative experiments showing the shift in the reversal potential of Imtx induced after increasing extracellular calcium from 2 to 5 mm. A, control currents (absence of MTX) in 145 mm symmetrical Na+ produced by voltage steps from a holding potential of 0 mV to −100 mV and then to 100 mV in 20 mV steps. B, currents induced by 500 pm MTX in the presence of 2 mm extracellular Ca2+. C, same cell as in B after raising extracellular Ca2+ to 5 mm. D, current–voltage relationship showing the mean values (n = 4) of the currents in 145 mm Na+ and 2 mm Ca2+ (○—○) or 5 mm Ca2+ (♦—♦). E, control currents (absence of MTX) in 145 mm symmetrical K+ and 2 mm TEA produced by voltage steps from a holding potential of 0 mV to −100 mV and then to 100 mV in 20 mV steps. F, currents induced by 500 pm MTX in the presence of 2 mm extracellular Ca2+. G, same cell as in F after raising extracellular Ca2+ to 5 mm. H, current–voltage relationship showing the mean values (n = 5) of the currents in 145 mm K+ and 2 mm Ca2+ (□—□) or 5 mm Ca2+ (•—•). The voltage scales in D and H show only the data between −30 and +30 mV to evidence the shift in the reversal potential. Horizontal dotted lines indicate the zero current level.
