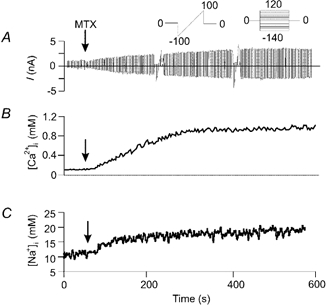
Figure 4. Time course of Imtx and the increments in intracellular Ca2+ and Na+ concentrations.

Concomitant measurements of current using patch clamp and intracellular Na+ and Ca2+ with fluorescent indicators. A, a typical experiment showing the time course of Imtx activation. The current was evoked with continuous ramps from −100 to +100 mV. The ramps were interrupted to perform voltage steps from −140 to +120 mV in increments of 20 mV (Vh = 0 mV) to obtain I-V curves. Voltage protocols shown in the inset. Vertical arrows indicate the time of addition of 500 pm MTX. B, time course of the changes in [Ca2+]i in response to MTX monitored with the fluorescent indicator fura-2. C, time course of the changes in [Na+]i monitored with the fluorescent indicator SBFI. Time scale is the same in all panels (shown at the bottom of the figure). Representative traces are shown from eight experiments.
